Rainfall
Our planet’s water circulates continuously from the atmosphere to land and oceans, and back again in a process known as the hydrological cycle. The hydrological cycle includes rainfall, percolation of water into the ground, and evaporation of water from oceans, among other processes. In this entire cycle, rainfall is our only source of fresh water. It is the primary source that sustains all secondary sources like rivers and groundwater.
Rainfall is measured in millimetres. Any place has an “average annual rainfall” that is taken as a reference based on the rainfall it has actually received over a long period of time (for eg: IMD uses average annual rainfall over 50 years, from 1951 to 2000). However, each place can receive significantly different rainfall in different years. The same place may have flood years and drought years, i.e., when rainfall is a certain percentage higher and lower than the normal levels respectively.
India gets annual rainfall of 1187 mm on average, but there are huge variations within the country. Mawsynram in Meghalaya, gets annual average rainfall of 11,873 mm, about 10 times the national average. This tiny hamlet currently holds the Guinness World Record for the highest average annual rainfall on the planet. On the other extreme is Jaisalmer, the district that gets the least average annual rainfall – 186.26 mm. Around 3500 rain gauge stations of the Indian Meteorological Department (IMD) collects rainfall data regularly. Overall, northwest India gets the least annual rainfall, while northeast states get the most.
Rainfall patterns for Bangalore over 100 years, from 1901 to 2000, show that annual rainfall has varied from as low as 500 mm to as high as 1350 mm, while the city’s average rainfall is 970 mm. If we look at rainfall for Bangalore region for the month of August alone, from 1951 to 2007, the variation is even wider. The lowest rainfall was 24.3 mm (1984), and the highest was over ten times this – 247.3 mm (1998). It is wise to understand rainfall and its changing patterns, being prepared to deal with its impacts, and adapting our lives in response to it.
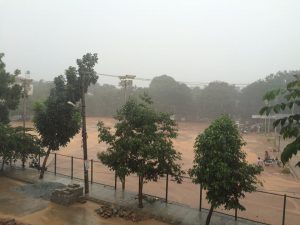
In Bangalore, rainfall peaks during the pre-monsoon in May, and later in September-October. While the pre-monsoon season has short spells of intense rains, monsoons bring longer spells of recurring rains. In the past, there was more opportunity for water to percolate into the natural ground in the city. However, with the paving of urban lands, surfaces become harder to penetrate and percolation has reduced because of the roads and buildings that cover large our city. Most rain water is now lost as runoff, carried away by stormwater drains.

You can measure the rainfall in own your premises by installing rain gauges, either automatic or manual. In Bangalore, manual rain gauges are supplied by vendors like Lawrence & Mayo, and automated ones by vendors like Yuktix. Real time data on rainfall is also measured by the state government’s Natural Disaster Monitoring Centre (KSNDMC), and is available here. Further data, like rainfall and forecast maps, and districtwise reports, are available here. KSNDMC has 86 weather stations in Bangalore urban taluk now. The centre gives detailed rainfall reports to NGOs, students, researchers etc., free of cost. Here is an example of rainfall analysis that was done using data accessed from KSNDMC.


